Ask two different sources what a home in Manette costs and you can end up with two different stories in the same season. One tracker showed the neighborhood's median sale price down more than 11 percent year over year in January 2026, at $429,000. Another, looking at the trailing 12 months through that spring, put the median at $470,500, up about 1 percent. Same neighborhood. Overlapping windows. A gap of more than $40,000 and opposite directions.
Neither number is wrong. That's the part buyers comparing Bremerton neighborhoods need to understand before they let a headline percentage change their offer strategy.
The number that didn't add up
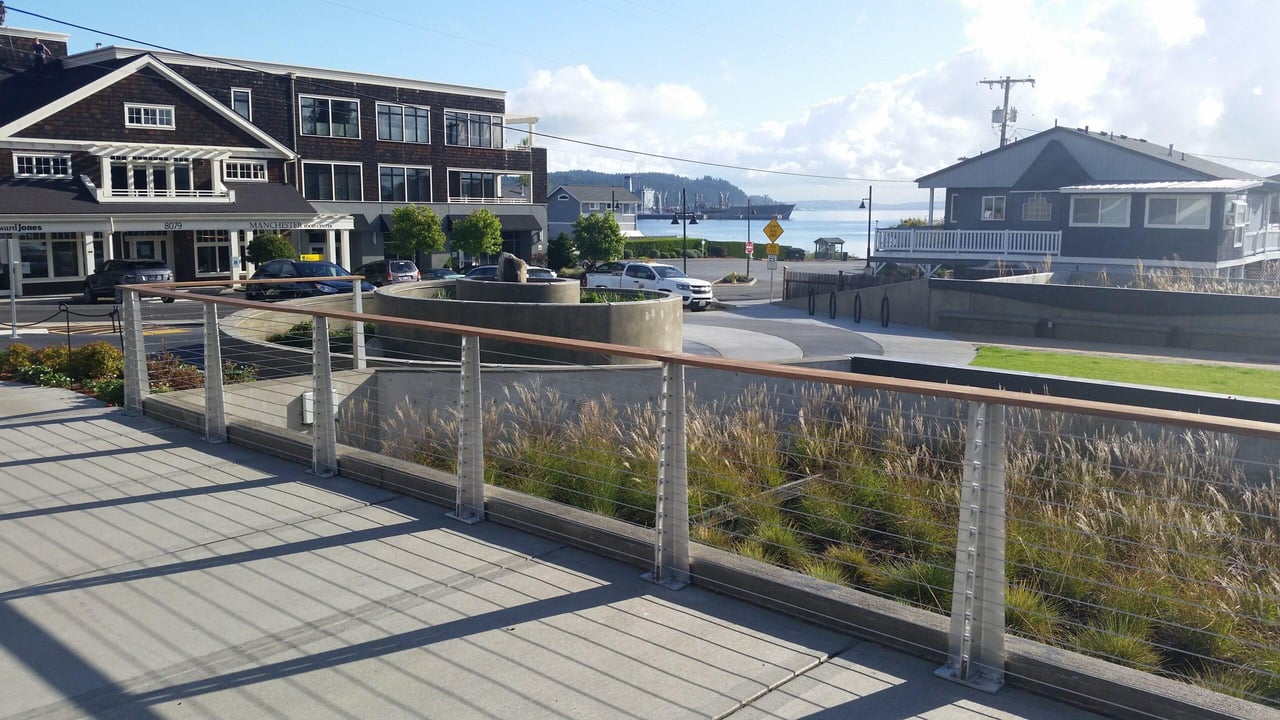
Manette gets talked about more than any other pocket of Bremerton. It's the neighborhood people mean when they say a Kitsap city can feel like a small town: the Manette Bridge connecting it to downtown, the annual Bremerton Bridge Blast that shuts the bridge down for a street party, a walkable strip near 11th Street where Two Sisters jewelry, Paul's Flowers, and the water-view Boat Shed Restaurant sit within a few blocks of each other. It's also, on paper, one of the more volatile price stories in the city.
In January 2026, Manette recorded just 11 home sales, up from 7 the year before. That's not a typo. Eleven sales is the entire dataset behind that month's reported median. When a $600,000 waterfront closing or a $255,000 condo sale lands in a pool that small, it can swing the median by tens of thousands of dollars without any actual shift in what homes are worth. That's why the same neighborhood can show an 11.5 percent year-over-year drop in one reading and a roughly flat, even slightly positive, 12-month trend in another pulled just a few months later. The underlying homes didn't get cheaper. The sample got small enough that a handful of transactions could tell almost any story.
Why one sale can move a median
Compare that to East Bremerton, a few minutes east along the Wheaton Way corridor. In the three months ending May 2026, East Bremerton logged 78 home sales in May alone, up from 51 the year before, with a median sale price of $473,000, up 5.2 percent year over year. That's not a neighborhood immune to swings. It's a neighborhood with enough transaction volume that no single sale can drag the median around.
This is the part that matters if you're cross-shopping neighborhoods rather than watching one house: a bigger sample smooths out noise. A smaller one amplifies it. Manette's median moves in ways that look dramatic because so few sales are setting it each month. East Bremerton's median moves in ways that are actually more trustworthy as a signal, precisely because more sales are averaged into it.
None of this means Manette is a bad bet. Homes there sold in as little as 7 days in January 2026, down from 47 days the year before, which tells you demand didn't cool even as the reported median did. It means the headline percentage change is a much weaker signal in a thin market than in a thick one, and Manette is a thin market by Bremerton standards.
What that means if you're cross-shopping Bremerton neighborhoods
If you're deciding between neighborhoods rather than deciding on one specific house, treat any single-month median with real skepticism, especially in a low-volume neighborhood. Ask how many homes actually sold in that window. A month with 11 sales and a big swing tells you less than a three-month rolling window with 50 or more sales behind it. When you're working with an agent on a neighborhood-level comparison, that's a fair question to ask about any number you're handed: how many transactions is this built on, and over what stretch of time.
The other useful check is direction over multiple windows, not the size of any one jump. East Bremerton's numbers moved differently depending on which window you looked at too. One monthly comparison showed prices down slightly, while the rolling three-month figure showed a solid year-over-year gain. That's normal in a market this size. The fix isn't finding the "right" number. It's looking at more than one window before drawing a conclusion.
What your money actually buys, neighborhood by neighborhood
Once you get past the noisy medians, the actual price tiers across Bremerton are fairly distinct, and they track geography and water access more than anything else:
- Charleston, on the city's southwest side near the shipyard and the Callow Avenue retail and music corridor, is running around $410,000 on recent sales, the most affordable of Bremerton's named pockets.
- East Bremerton, the largest and highest-volume market in the city, is landing in the high $450,000s to low $470,000s depending on the window, with more consistent trend data than almost anywhere else in Bremerton.
- Manette spans the widest range of any single neighborhood. Reported medians have ranged from roughly $429,000 to $517,000 depending on the month and the mix of what sold, while condos start closer to $255,000 for a one-bedroom and homes with real water views run $850,000 to $965,000. The address is the same. The product is not.
- Chico and Tracyton, on Bremerton's western edge along Dyes Inlet, sit higher, typically $650,000 to $850,000, trading city convenience for more land and a quieter, lake-and-inlet setting.
- Illahee, Bremerton's premium waterfront pocket, regularly clears $700,000 and can pass $1.1 million for direct Puget Sound frontage.
The spread inside Manette is the clearest illustration of why a single "neighborhood median" can mislead. A hillside bungalow with a partial mountain view and a no-bank waterfront property with 180-degree Sound views are both "Manette." Their prices aren't in the same conversation.
The other tell: how fast homes move
Days on market tells you something a median can't. Manette's fastest recorded pace was 7 days in January 2026. East Bremerton has been running 8 to 11 days across recent windows. Both are fast by any national standard. Neither is fast because of a marketing gimmick. It's demand pressure from a fairly narrow source: the Puget Sound Naval Shipyard, which employs roughly 15,000 civilian workers alongside 8,000 active-duty military according to reporting from Seattle's Daily Journal of Commerce, plus a steady flow of Seattle-bound remote and hybrid workers using the passenger ferry.
That demand has deep roots. Downtown Bremerton's waterfront, the same stretch that anchors both the Manette side of the bridge and the ferry commute, has drawn real development dollars over the past several years, including Sound West Group's roughly $129 million Marina Square project near the ferry terminal and the earlier restoration of the historic Roxy Theater at Quincy Square. Neither project sits inside Manette's or East Bremerton's boundaries, but both are part of why the waterfront pull on this city hasn't faded, even when a given neighborhood's median price tells a confusing story for a month or two.
Reading the market like it's your job, not a headline
The mistake is treating every Bremerton neighborhood's price data the same way. A thick market like East Bremerton, with dozens of monthly sales, will give you a median you can lean on with reasonable confidence. A thin one like Manette will give you a number that jumps around because it has to, statistically, with so few transactions setting it. Neither fact should scare you off a neighborhood. It should just change how much weight you put on any single month's headline.
A couple of questions worth asking before you lean on any number
If Manette's median price dropped, does that mean values are actually falling there? Not necessarily. With as few as 11 sales setting a month's median, the mix of what happened to close, whether it skewed toward condos or waterfront homes, can move the number more than any real shift in value. Days on market and sales volume are better indicators of real momentum than a single month's median in a neighborhood this size.
How do I know if a neighborhood's price trend is one I can trust? Look at the sales count behind it. A trend built on 50-plus monthly sales, like East Bremerton's, is a sturdier signal than one built on a dozen. When volume is thin, favor rolling three-month or 12-month windows over any single month, and ask whatever agent or source is quoting you a stat how many transactions it's actually built on.
Comparing neighborhoods on paper only gets you so far. If you want someone to walk the actual numbers with you, block by block, Wendy Crenshaw has been doing exactly that across Kitsap County since 1998. Let's Connect.